Back to blog
9 Landing Page KPIs You Should Track in 2026
Discover key landing page KPIs to track, helping you measure performance, optimize design, and improve conversions for better results.
Mar 18 2025
You’ve probably heard about KPIs, so you know they are important for your landing page, but you don’t know how important nor what exactly KPIs stand for.
You’re in the right place then.
Read on to learn why landing page KPIs are essential for conversion and what metrics you should track to optimize your landing page.
Let’s dive in!
What are KPIs and Why Do They Matter for Your Landing Page?
Key Performance Indicators, or KPIs, are measurable values that show how effectively your business is achieving key business objectives.
They serve as a vital tool for assessing success and making data-driven decisions. For any business, especially the digital one, KPIs play a crucial role in:
- understanding performance,
- optimizing strategies, and
- ultimately achieving growth.
This is particularly true for landing pages, which are often the first point of contact for potential customers in their decision-making journey.
Leveraging KPIs not only helps improve landing page performance but also enables you to stay ahead of competitors by continuously refining your approach based on data insights.
Without tracking KPIs, it becomes challenging to assess the effectiveness of your strategies or to implement targeted improvements.
On the other hand, with a data-driven approach, landing pages can transform from mere digital spaces into powerful tools for conversion and growth.
9 Landing Page KPIs You Should Start Tracking Today
Let’s check what key landing page KPIs you should pay attention to.
1. Conversion Rate
One of the most critical KPIs is the conversion rate, which measures the percentage of visitors who take a desired action on your landing page:
- filling out a contact form,
- signing up for a newsletter or
- making a purchase.
How to calculate it: Divide the total visitors by the number of conversions and multiply by 100.
For example, if your landing page receives 1,000 visitors and 50 of them complete the desired action, your conversion rate is 5%.
Conversion rates vary significantly across industries, but here are some general benchmarks.
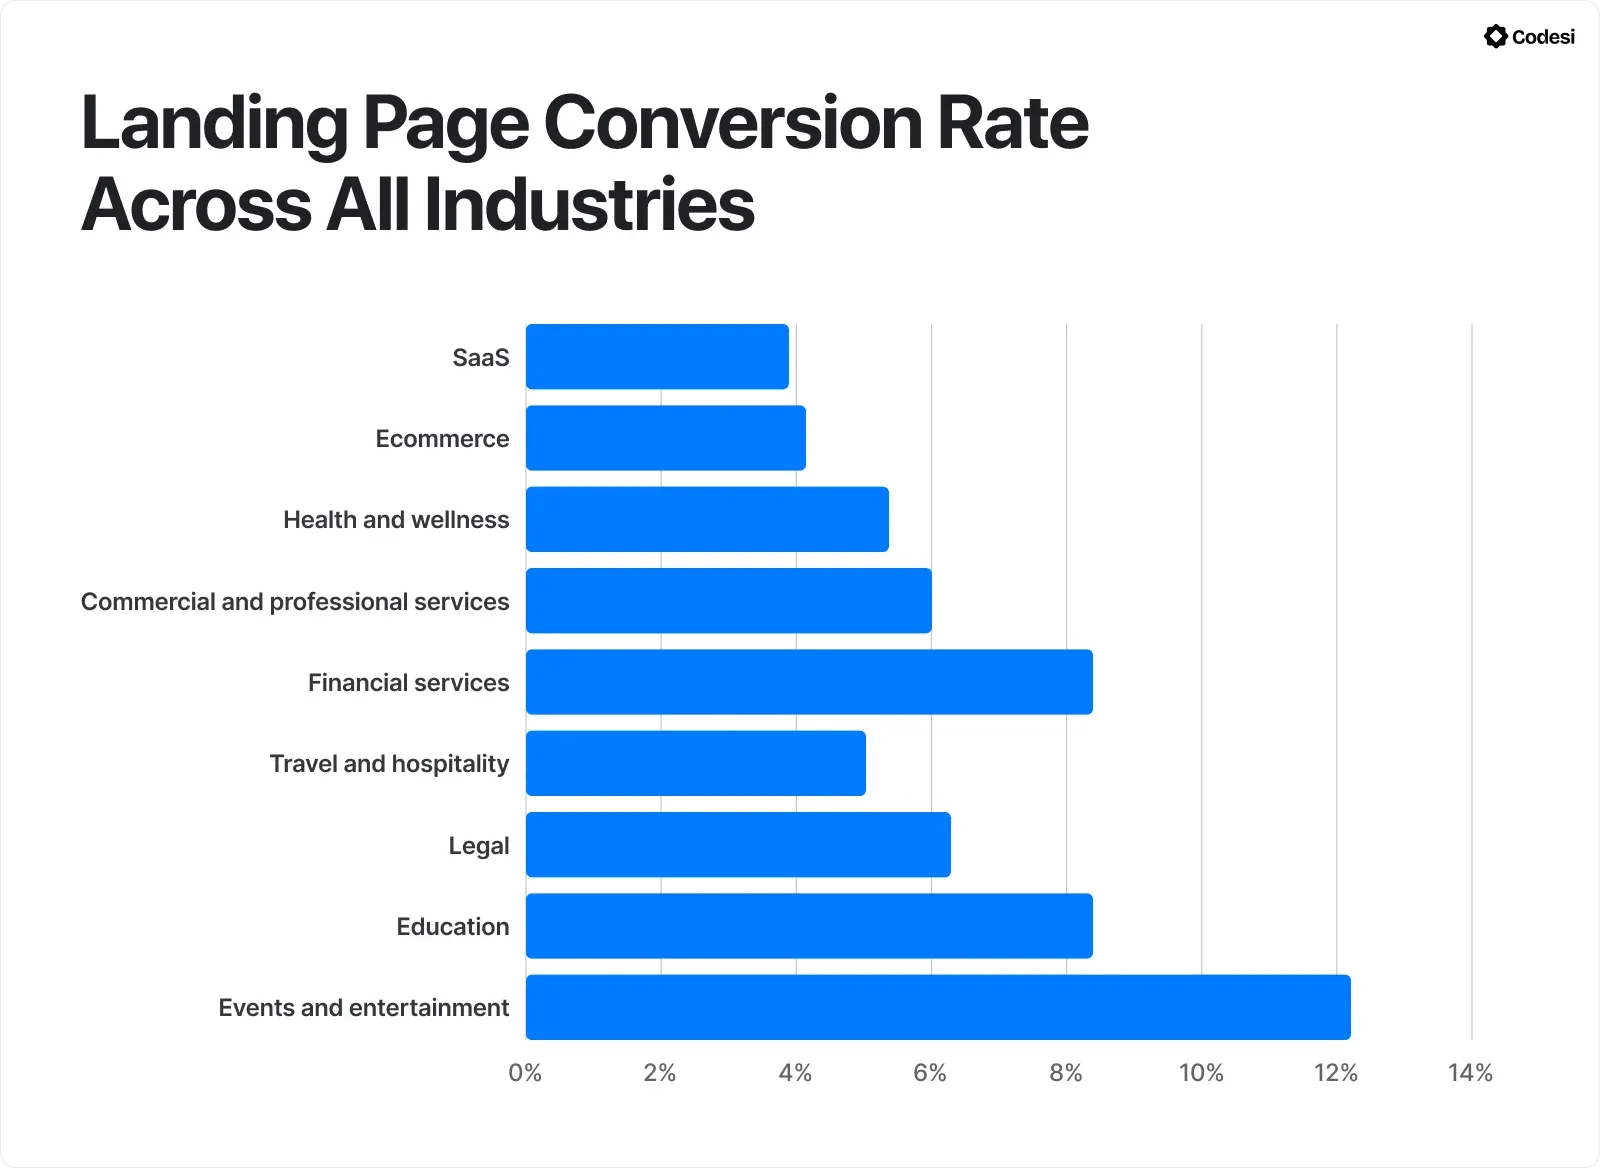
Source: Unbounce
A conversion rate above 5% is generally considered strong, while rates above 10% are exceptional. eCommerce conversion rates typically range from 3% to 5%.
💡 ProTip:
Did you know that besides helping you generate a fully functional and tailored landing page in under 10 minutes, Codesi also provides integrations with Google Analytics and Yandex to track traffic and conversions?
This way, you can test your page and find the optimal version based on valid, real-time data.
2. Bounce Rate
The bounce rate evaluates the effectiveness of a landing page.
It measures the percentage of visitors who leave a website without taking any further action beyond viewing the initial page.
A high bounce rate can signal that your content is not engaging enough or that your landing page is not aligned with users’ expectations.
How to calculate it: You should divide the number of single-page sessions by the total number of sessions and multiply by 100.
So, if 100 visitors land on your page and 50 leave without further interaction, your bounce rate is 50%.
Same as with conversion rates, bounce rates are industry-specific.
For landing pages, due to their converting nature, a lower bounce rate is generally desirable.
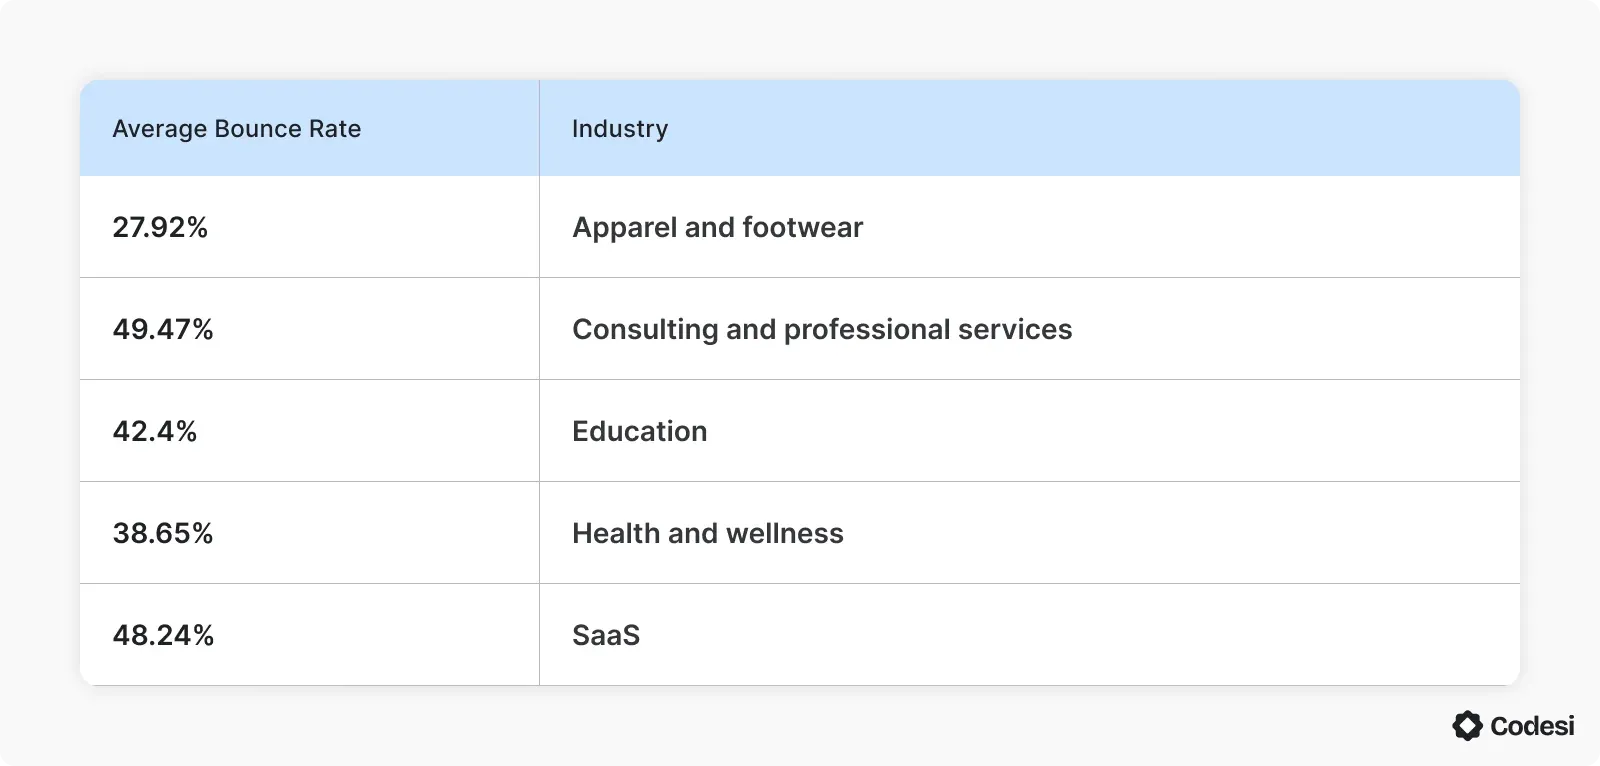
Source: Semrush
Factors Influencing Bounce Rates:
- Relevance and Quality of Content: If the content doesn’t match visitor expectations, they are more likely to bounce.
- User Experience: Slow loading speeds, poor navigation, and cluttered design can increase bounce rates.
- Traffic Quality: Well-targeted traffic tends to have lower bounce rates than poorly targeted traffic.
How to improve bounce rates:
- Optimize images, leverage browser caching, and minimize code to ensure fast loading times.
- Design mobile-friendly landing pages to cater to the growing number of mobile users.
- A well-defined CTA can guide users toward desired actions, reducing the chance of the visitors leaving your landing page prematurely.
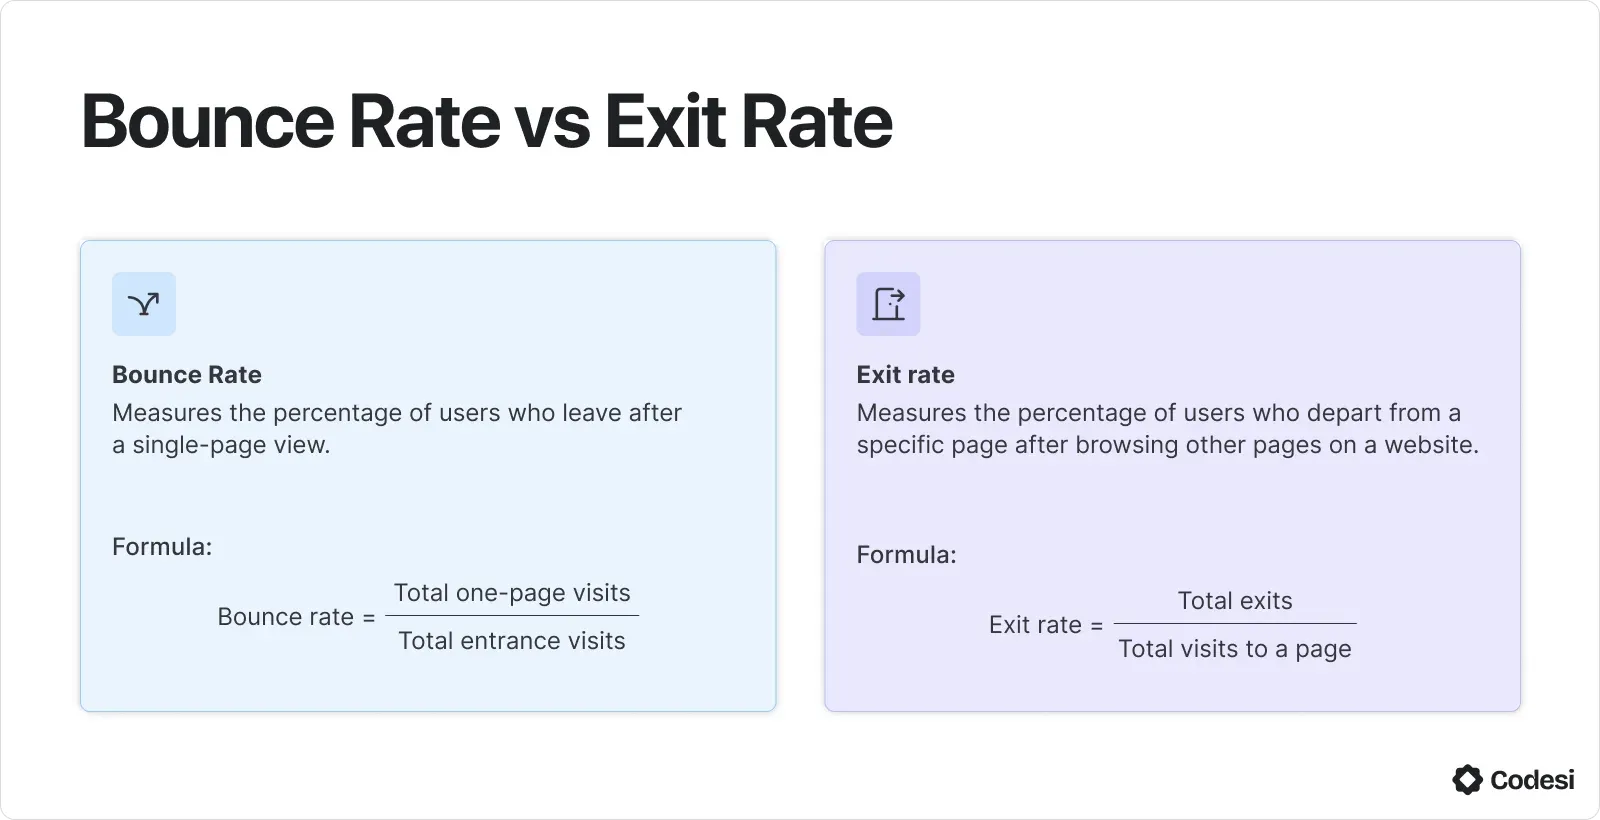
Before we move on, check below the differences between 2 commonly confused rates: bounce and exit rates.
3. Landing Page Views
Landing page views refer to the number of times visitors visit your landing page.
This metric is crucial for evaluating the reach and effectiveness of a landing page in attracting and engaging potential customers.
A high number of landing page views indicates successful traffic acquisition strategies, such as effective advertising or SEO efforts.
While views alone don't guarantee conversions, they provide a baseline for measuring engagement and conversion rates.
Thus, a large number of views can lead to more opportunities for conversion if you optimize the page correctly.
By tracking landing page views, you can determine which channels, such as social media, email, etc., are driving the most traffic.
4. Sessions By Source
Sessions by Source tracks the number of website sessions generated by different traffic sources.
This includes sources like
- organic search,
- paid search,
- social media,
- email marketing, and
- direct traffic.
Understanding sessions by source helps you evaluate the effectiveness of various marketing channels in driving traffic to your landing page.
Thus, it is crucial to optimize marketing campaigns and allocate resources effectively.
If your website receives 1,000 sessions per month, with:
- 400 from organic search,
- 300 from paid search, and
- 300 from social media, you can analyze these figures to determine which channels are most effective for your business.
For instance, if organic search generates more conversions than paid search, you might focus more on SEO efforts.
💡 Worth Knowing
Google Analytics 4 is a popular tool for tracking sessions by source.
It provides detailed insights into traffic sources and helps you compare the effectiveness of different marketing channels.
How to get started with Google Analytics 4?
There are 2 ways to get started if you are an editor or administrator:
- Option 1: Set up Analytics data collection for the first time.
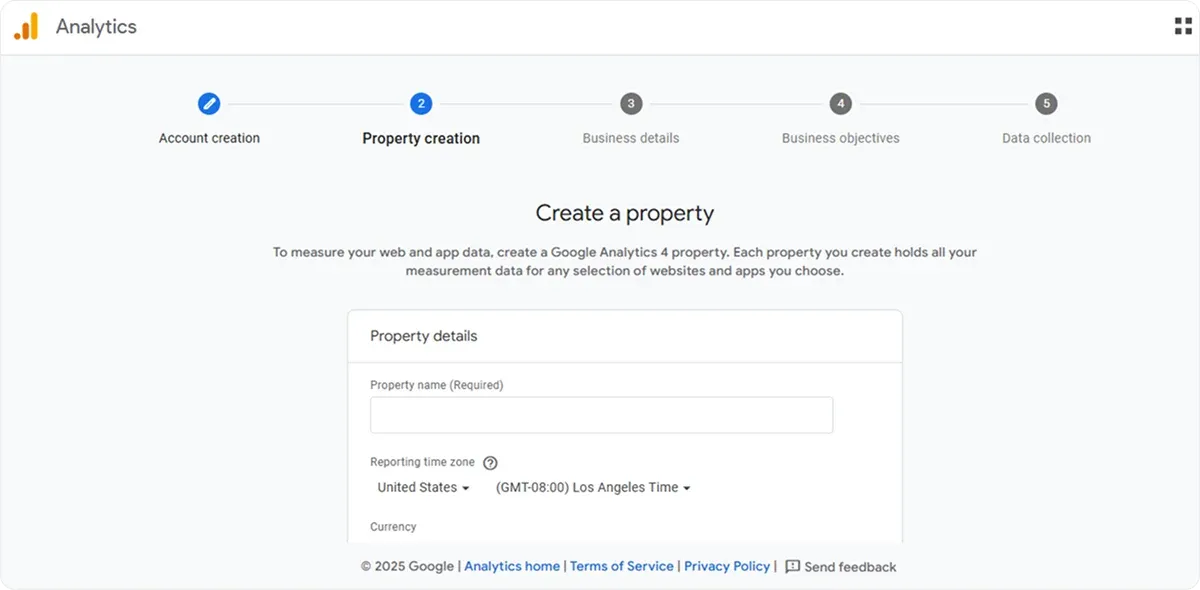
Do this if you’re new to Analytics and ready to collect data for your website and/or app.
- Option 2: Add Google Analytics 4 to a website builder platform or CMS (content management system). Go to: Admin > Property > Data Streams > Web, to create your Google Tag ID.
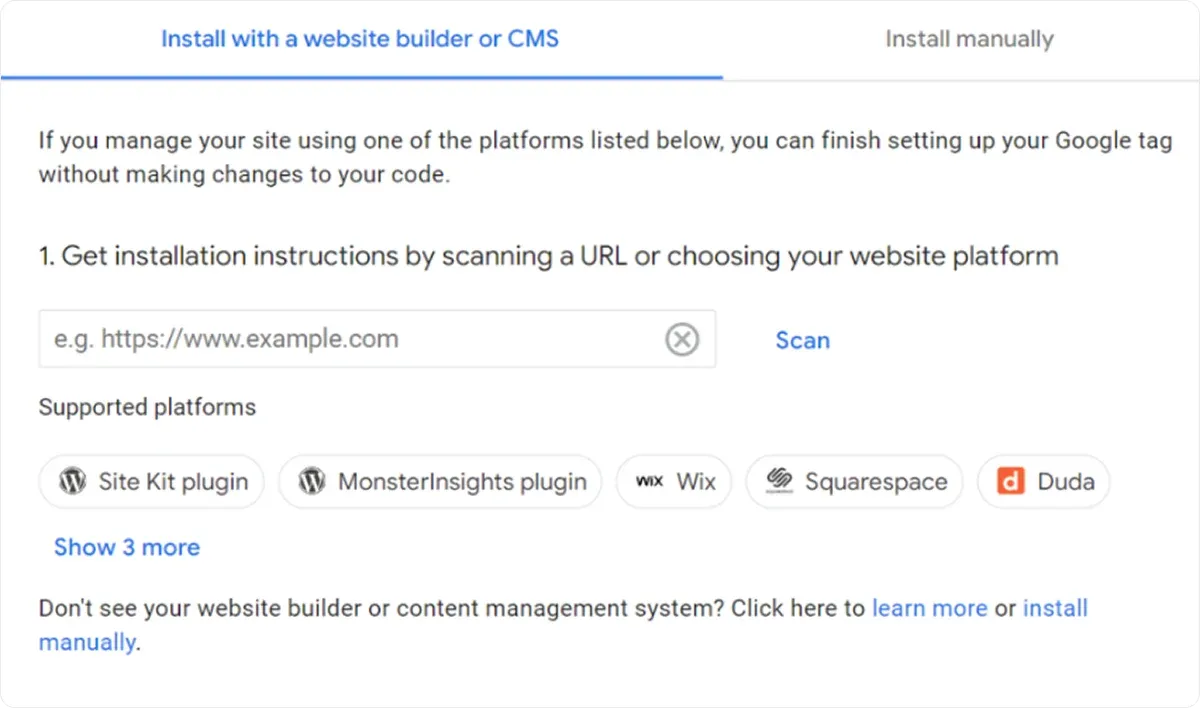
You’ll get your site’s tag ID, which you can copy and paste by following the instructions for the respective CMS platform you’re using.
Do this if you use a CMS-hosted (Content Management System) website, e.g. a website created using Wix, WordPress, Drupal, Squarespace, GoDaddy, WooCommerce, Shopify, Magento, Awesome Motive, HubSpot, etc.
5. Average Time on Page
The Average Time on Page measures the time difference between when a user lands on a page and when they move to another page or leave the site.
If a user only visits one page without further interaction, the time on page is recorded as zero. Remember the bounce rate?
How to calculate it: Divide the total time spent on a page by the number of non-exit page views. You should exclude bounces and exit pages from the calculation.
Let’s say your landing page had 2,000 page views with 500 being bounces or exits.
If the total time spent on the page was 500 minutes, the average time on page would be calculated as follows:
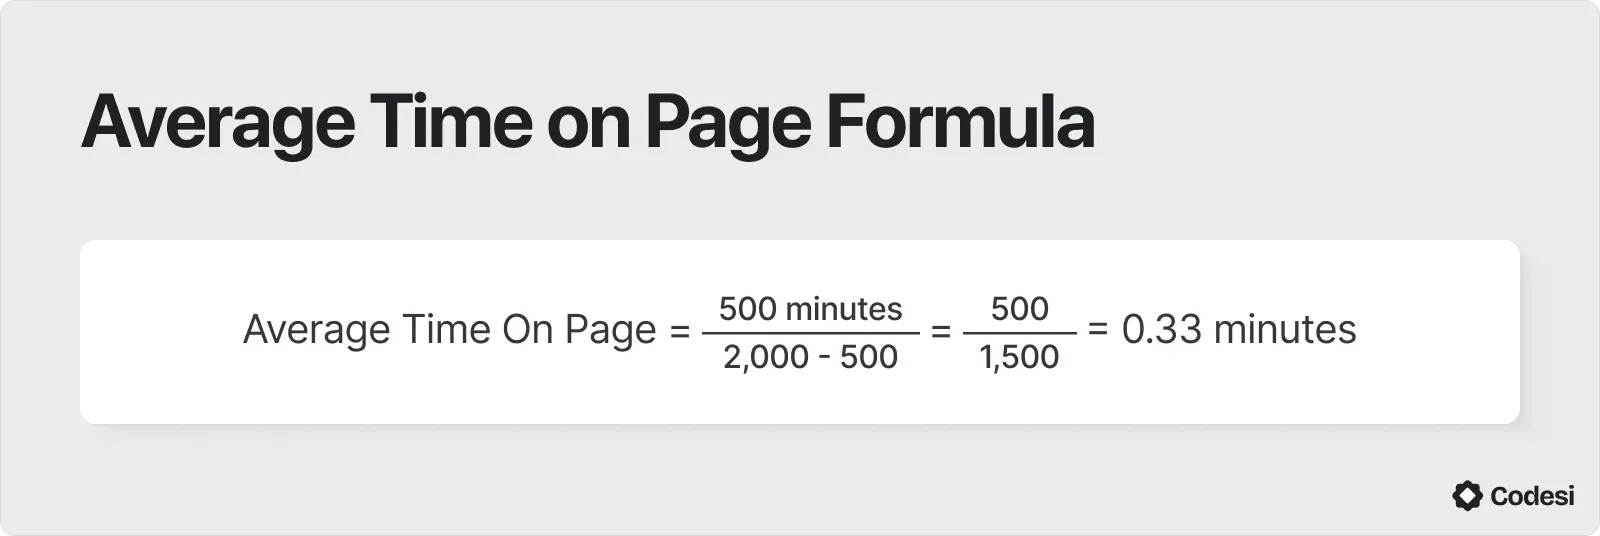
This translates to approximately 20 seconds per non-exit page view.
Besides usual remedies such as having a mobile-friendly landing page with optimal loading speed, you can also use interactive elements and incorporate:
- Videos,
- Quizzes, or
- Interactive tools to increase engagement.
6. Cost Per Conversion (CPC)
CPC measures the cost of achieving a desired action or conversion through an advertising campaign.
Tracking CPC enables you to identify areas for improvement, such as targeting the wrong audience or using ineffective ad copy.
Moreover, CPC is essential for determining the ROI of marketing efforts, ensuring that the cost of acquiring customers aligns with their value.
How to calculate it: You should divide the total cost of the campaign by the number of conversions. The calculation is pretty straightforward.
Thus, if a campaign costs $1,000 and results in 10 conversions, the CPC is $100 per conversion.
As you may expect by now, the average CPC depends on the industry. In eCommerce, a CPC of around $10-$30 is considered good.
Tips for Managing CPC
- Optimize Ad Targeting: To increase conversion rates and reduce CPC, ensure that ads are shown to the most relevant audience.
- Improve Ad Copy: Enhance ad messaging to better resonate with potential customers and encourage more conversions.
- Monitor and Adjust: Regularly review CPC data to identify cost reduction and campaign optimization opportunities.
7. Form Abandonment
Form abandonment means that visitors begin filling out an online form but fail to complete and submit it.
Unfortunately, this common issue can occur at any point during the form-filling process, leading to lost leads and sales.
According to Zuko’s benchmark report, although 66% of people who start a form complete it, only 45% actually convert.
- With 75%, application forms have the highest completion rates, whereas contact forms have the lowest conversion with only 38%.
- Checkout forms take the longest to complete, while registration forms take the least time.
4 Most Common Causes of Form Abandonment
- Length and Complexity: Long forms with too many fields can deter visitors from completing them
- User Experience Issues: Poorly designed forms with unclear instructions or slow loading times can frustrate visitors
- Mobile Optimization: Forms not optimized for mobile devices can lead to high abandonment rates.
- Required Fields: Too many required fields can increase friction and lead to abandonment. The password field has a high abandonment rate of 10.5%, followed by the email and phone number fields with 6.4% and 6.3%, respectively.
Luckily, there is a solution to any problem. To decrease the form abandonment rate, try one of the following strategies:
- Reduce the number of fields and make them optional where possible.
- Ensure forms are responsive and easy to use on mobile devices.
- Provide clear labels and instructions to reduce confusion.
- Use progress bars or indicators to show users how much of the form is left to complete.
- Allow users to save their progress and return later to complete the form.
8. Return vs. New Visitors
Return vs. New Visitors may not be a typical KPI, but it’s closely related to the essential ones, and it indicates brand loyalty and the effectiveness of retargeting efforts.
New visitors are crucial for expanding your audience and increasing brand awareness. However, they often have higher bounce rates and lower conversion rates compared to returning visitors.
On the other hand, returning visitors typically spend more time on your page, have lower bounce rates, and are more likely to convert into customers, boosting customer loyalty.
An ideal balance between new and returning visitors should be around 30% to 50% of returning visitors.
Which marketing strategies to apply to attract and keep these 2 different visitor segments?
- For new visitors, focus on lead generation and user acquisition strategies such as SEO, social media marketing, and paid advertising to attract new visitors.
- For return visitors, implement customer retention strategies such as email marketing, loyalty programs, and personalized content to encourage repeat visits.
9. Load Speed
Last but not least is your landing page load speed. It refers to the time it takes for a landing page to fully load and become interactive for users.
It is a critical factor in:
- User Experience: Fast load speeds provide a better user experience, as users expect pages to load quickly — typically within 3 seconds. Slow sites can lead to frustration and high bounce rates.
- SEO Rankings: Page speed is a confirmed ranking factor for search engines like Google. Faster sites are more likely to rank higher in search results, improving visibility and organic traffic.
- Conversion Rates: Load speed directly affects conversion rates. Even slight delays can result in significant losses.
Some ways to improve load speed include optimizing images, compressing the size of CSS, JavaScript, and HTML files, enabling browser caching, and others.
Popular speed test tools include Google Pagespeed Insights, GTMetrix, Pingdom Website Speed Test, and WebPageTest.
Landing Page KPIs: Key Takeaways
The most important thing to remember is that all landing page KPIs work together to provide a better understanding of user behavior and preferences.
Thus, although each KPI plays a vital role, you shouldn’t observe their values individually.
Only by looking at these metrics together can you pinpoint places that need improvement.
If you paid close attention, you may have noticed that one aspect seems crucial for balancing KPI rates and improving conversions — Having an optimized and tailored landing page.
The good news? There is an AI tool that can help you not only create fully functional landing pages at the speed of light but also help you track conversion and traffic to make data-driven decisions.
Say hello to Codesi!
How Can Codesi Help You Optimize Your Landing Page for More Conversions?
Codesi is an AI landing page builder that enables you to craft fully functional landing pages in under 10 minutes.
We only need your text prompt, and in return, you’ll get a landing page with copy, CTAs, page structure, design, and other elements.
Moreover, all elements are customizable, so you can:
- Change the layout,
- Rearrange elements,
- Choose and delete blocks,
- Apply color changes and more.
🔥 Backed with an AI logo and image generator that work on the same principle and allow further customization and personalization, you can create a landing page that truly reflects your brand voice and meets your target audience’s expectations.
🔥 Moving away from over-generic images and templates allows you to create engaging and meaningful content and visuals, captivating more visitors to stay longer on your page.
🔥 In addition, Yandex and Google analytics integrations help you identify areas for improvement, allowing you to test multiple scenarios and see what performs better.
Ready to take Codesi for a spin?
Start with Codesi for free and create landing pages to keep your KPIs in order while boosting conversions.
Keep Learning
10 Landing Page Mistakes to Avoid
Create your website with AI today
Codesi is a platform where you can make a website in 3 minutes.
No coding, no designers, no hassle - just AI.
